Rude Awakening: Unmasking Sleep Obfuscation With TTTracer
Contents
- Intro
- Sleep Obfuscation Is Powerful
- What Is TTTracer?
- The Theory
- Practical Usage
- Certainly Not A Silver Bullet
- Conclusion
Intro
Detecting modern day evasive implants is a monsterous task. It feels like every few months one of the big providers puts out a blog post about the new defense evasion features they've implemented that make our lives much harder, and if utilised by real actors, could cause massive damage. Hopfully today I can temporarily hand some power back to the blue team with this post, outlining a relatively trivial method for dumping sleep obfuscated implants in a decrypted state using tools that already exist on most Windows machines.
Acknowledgement
Special thanks and credit to DebugPrivilege for his excellent debugging tutorials using WinDBG. It's an absolute gold mine for blue teamers. Follow him on twitter and definitely have a read of his debugging repo!Sleep Obfuscation Is Powerful
Almost all modern C2 implants use some form of sleep obfuscation that looks a little something like this:
┌───────────────────────────────────────────┐
│            Implant Is Executed            │
└─────────────────────┬─────────────────────┘
                      │
┌─────────────────────▼─────────────────────┐
│          Implant Encrypts Itself          ◄───┐
└─────────────────────┬─────────────────────┘   │
                      │                         │
┌─────────────────────▼─────────────────────┐   │
│ Implant Stays Dormant For Configured Time │   │
└─────────────────────┬─────────────────────┘   │
                      │                         │
┌─────────────────────▼─────────────────────┐   │
│          Implant Decrypts Itself          │   │
└─────────────────────┬─────────────────────┘   │
                      │                         │
┌─────────────────────▼─────────────────────┐   │
│   Implant Fetches & Performs Operations   ┼───┘
└───────────────────────────────────────────┘
Traditional memory scanners have a very hard time against this since the chance you perform a scan while the beacon is in a decrypted state is almost zero. Some EDRs may attempt to perform some kind of memory anomaly detection around flickering page permissions or usage of built in encryption methods however, generally speaking these methods are incredibly resource intensive and are not high fidelity indicators of malicious activity. For us on the defending side, mass memory scanning or memory behavioral analysis is still a challenge.
What Is TTTracer?
Did you know that there are WinDBG components preinstalled on modern Windows? I certainly didn't! tttracer.exe is preinstalled on Windows and is the command line utility for capturing Time Travel Debugging sessions of running processes.
Time Travel Debugging is an incredible debugging feature of modern WinDBG allowing you to record a full execution session of a running process to then play back in the WinDBG debugger. Not only can you play back the execution but you can also step the instruction backwards which is incredibly useful if you make a mistake or want to replay a certain section of execution.
The Theory
Traditional memory dumps are ineffective against implants leveraging sleep obfuscation since you'll most likely be dumping junk data. However, since tttracer.exe is taking a capture of a full execution, if we capture for long enough the decrypted implant should be recorded.
For this proof of concept I'll be using a Havoc Demon implant with Ekko sleep obfuscation, executing it and using tttracer.exe to capture part of the execution session then pulling back the trace file and extracting the unencrypted implant.
Below is the config for the Havoc payload:
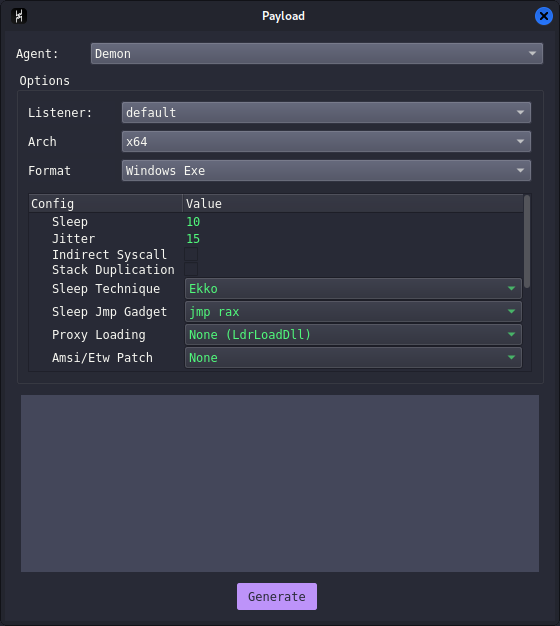
To keep the proof of concept simple, Havoc will be executed standalone in the .exe format. In the real world this analysis will be slightly harder since you'll be capturing the execution of a legitimate process that the implant is injected into however the overall concept still applies!
To capture a trace simply open cmd.exe as admin and run the following:
tttracer.exe -attach <pid>
Since my Havoc config is set to sleep for 10 seconds I waited 20 seconds just to make sure it had time to decrypt then ended the trace using CTRL+C.
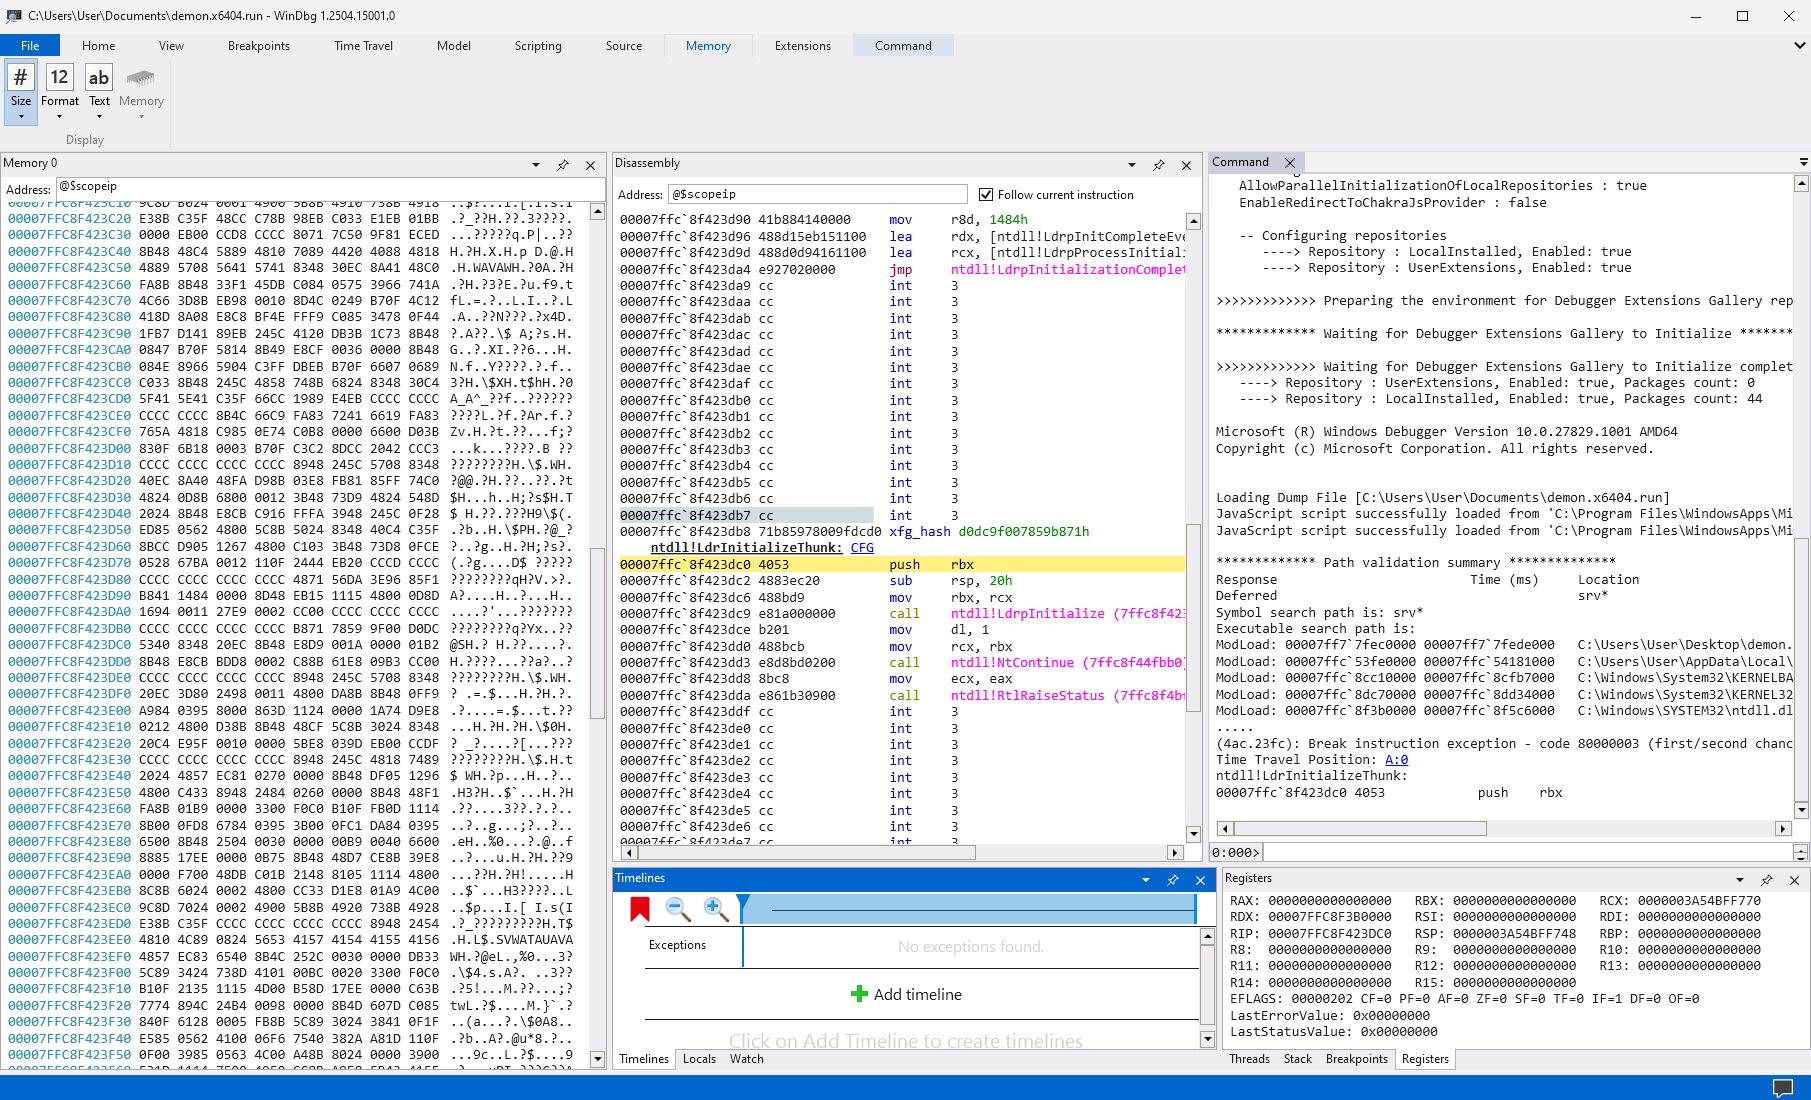
Now that we have our capture we can open it in WinDBG:
Let's start by finding the start of the .text section. To do this we can run lm:
0:000> lm

start             end                module name
00007ff748820000  00007ff74883e000   demon_demon  (no symbols)
00007ffc5aba0000  00007ffc5ad41000   TTDRecordCPU (deferred)
00007ffc7bc80000  00007ffc7bd36000   webio        (deferred)
00007ffc7ec20000  00007ffc7ec48000   SRVCLI       (deferred)
00007ffc82e50000  00007ffc82e6f000   dhcpcsvc     (deferred)
00007ffc82f40000  00007ffc82f59000   dhcpcsvc6    (deferred)
00007ffc83030000  00007ffc83166000   WINHTTP      (pdb symbols)
00007ffc84470000  00007ffc8447d000   WINNSI       (deferred)
00007ffc84620000  00007ffc84639000   SAMCLI       (deferred)
00007ffc854f0000  00007ffc8550a000   WKSCLI       (deferred)
00007ffc87d80000  00007ffc87d99000   NETAPI32     (deferred)
00007ffc89b40000  00007ffc89bd7000   apphelp      (deferred)
We can see the start address of the main module is 0x7ff748820000.
If we open the Memory View we can observe what appears to be junk data:
Now we have a few options to break the trace at a point where Havoc is decrypted:
- We can set a breakpoint on a network function as we know this can't be performed while sleeping
- We can attempt to breakpoint on changing bytes in the
.textsection. (note that of course this method requires more trial and error especially if the implant utilises module stomping as you might need to check multiple modules)
For simplicity's sake I've set Havoc to not utilize Indirect Syscalls so we can break on winapi functions as normal. In this instance we can break on WinHttpOpenRequest:
bp winhttp!WinHttpOpenRequest
Once the breakpoint is set we can press Go or Go Back (sometimes it's fiddly so I just press each a few times until the .text section changes) and we should see the real MZ header!
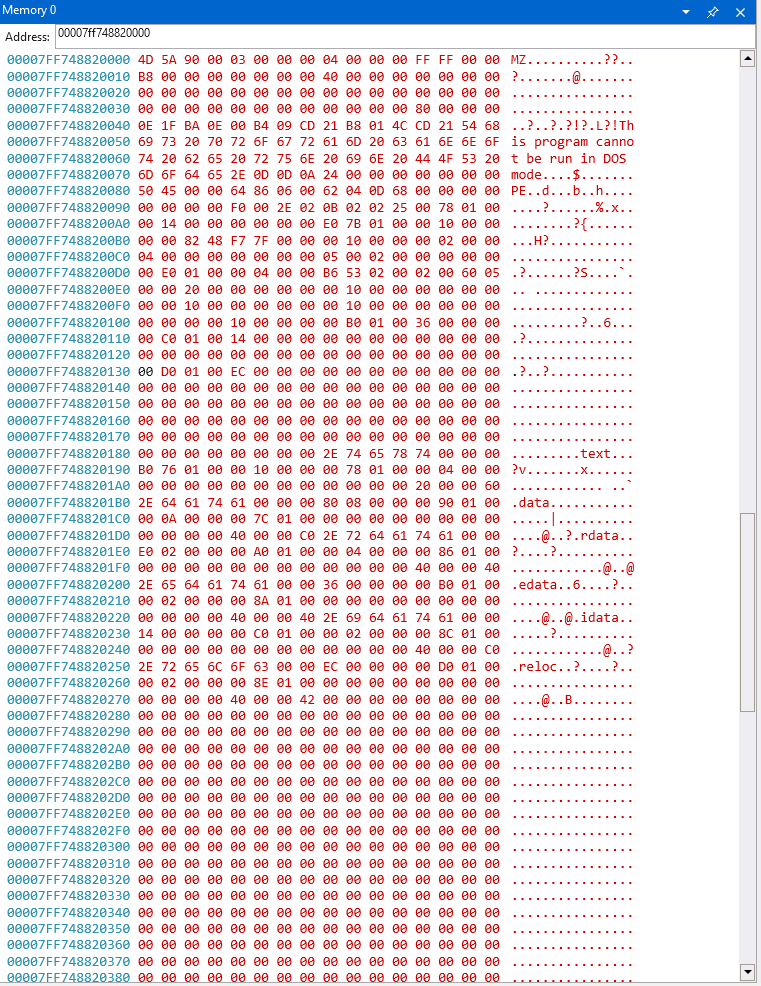
We could just dump the .text section here but we can also read out the config. In Havoc's case some of it is stored in the .data section. We can find it by using our module address to then dump the headers using the !dh command:
0:000> !dh 00007ff748820000

File Type: EXECUTABLE IMAGE
FILE HEADER VALUES
	8664 machine (X64)
	6 number of sections
	680D0462 time date stamp Sat Apr 26 09:05:54 2025
	0 file pointer to symbol table
	0 number of symbols
	F0 size of optional header
	22E characteristics
		Executable
		Line numbers stripped
		Symbols stripped
		App can handle >2gb addresses
		Debug information stripped

OPTIONAL HEADER VALUES
		[...]

SECTION HEADER #1
	.text name
	176B0 virtual size
	1000 virtual address
	17800 size of raw data
		400 file pointer to raw data
		0 file pointer to relocation table
		0 file pointer to line numbers
		0 number of relocations
		0 number of line numbers
	60000020 flags
		Code
		(no align specified)
		Execute Read

SECTION HEADER #2
	.data name
		880 virtual size
	19000 virtual address
		A00 size of raw data
	17C00 file pointer to raw data
		0 file pointer to relocation table
		0 file pointer to line numbers
		0 number of relocations
		0 number of line numbers
	C0000040 flags
		Initialized Data
		(no align specified)
		Read Write
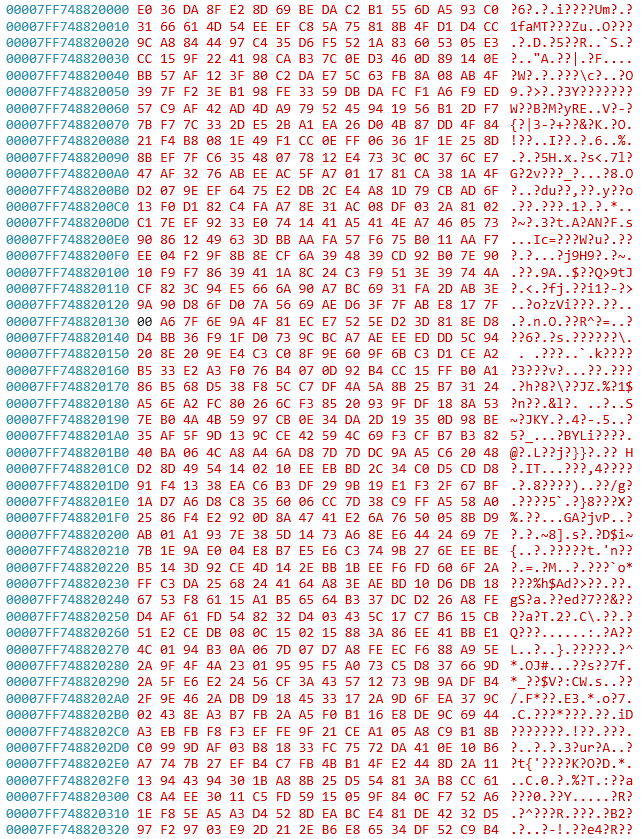
If we go back to the Memory View and put our base address plus our .data virtual address we can quickly view the .data section 00007ff748820000+19000:
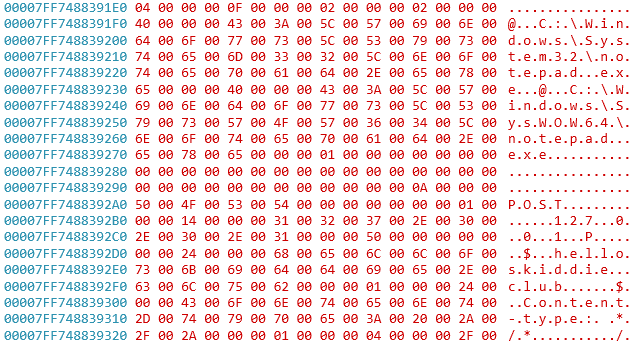
Hey look there's the C2 domain!
Practical Usage
From my limited testing, this appears to be FAR MORE effective than taking a standard process dump of a suspected process. Not only because we can actually retrieve the decrypted beacon but also because:
- We can potentially track the actual activities performed by the implant in the execution window
- We can trace child processes spawned by the implant
- We can perform further analysis at a later date especially if the capture is over a longer period of time
- This is implant agnostic
I can see this method being used as an EDR response task or for IR teams to more easily collect potentially evasive samples for advanced analysis.
Certainly Not A Silver Bullet
Any red team operators or malware developers can poke holes in this idea very quickly:
- Long haul beacons sleeping for multiple hours or days potentially make the analysis of the capture much much harder
- This requires manual analysis for unusual implant execution
- Unloading or tampering with the attached debugging dll would be trivial to either prevent a session capture or to output garbage session data
It's also worth noting that even if you did dump the decrypted beacon, writing traditional Yara rules likely won't help much since the mechanism of running the Yara rule in memory will run into the same issues as traditional memory scanning where we would have to run it against the memory region while it is in its decrypted state.
However, against real world actors this could be quite an effective method of dumping C2 information. In my previous role as a live response analyst I've dumped countless Cobalt Strike configs and I don't think I've ever seen a real world actor deploy a sleep mask over 60 seconds. In a pinch this could (and is already probably used) to grab configs from beacons with Sleep Mask enabled.
Conclusion
As of today, implants that don't have measures in place to prevent Time Travel Debugging are not opsec safe and can be dumped decrypted with relative ease.
The beauty of this method is that no extra binaries need to be introduced to the compromised host. Allowing for a rather stealthy and obscure method of what I will call "dynamic process dumping". The versatility of WinDBG and TTD must be acknowledged, I think many blue teamers are sleeping (pun intended) on this monster of an analysis tool. I'm sure some malware analysts are already using TTD for similar analysis but I hope this post highlights its potential use in live response.
Blue teamers rise up, follow me on twitter and check out some other cool research by my friends at helloskiddie.club